Averages Explained: The Difference Between Mean, Median, and Mode
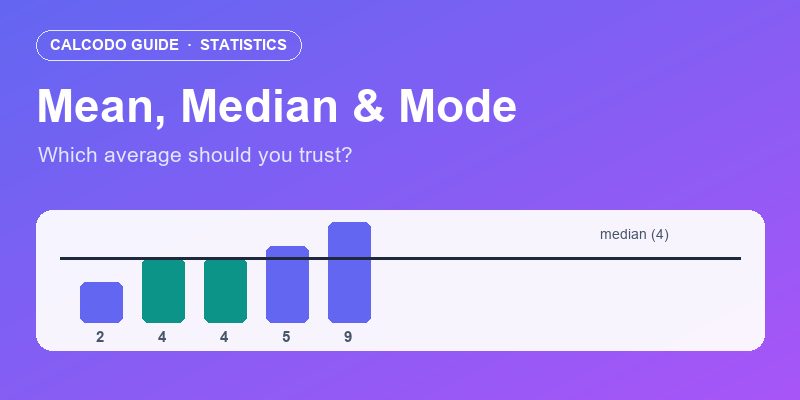
We see the word "average" used constantly in news headlines—average home prices, average test scores, average lifespan. However, in statistics, there is no single mathematical function called "average." Instead, there are three distinct measures of central tendency: the Mean, the Median, and the Mode. Depending on which one is used, the "average" can paint entirely different pictures of reality.
The Mean: The Mathematical Average
The mean is what most people think of when they hear "average." You calculate it by adding up all the numbers in a dataset and dividing by the total count of numbers.
The Flaw: The mean is highly sensitive to extreme outliers. If 9 people in a bar earn $50,000 a year, and Elon Musk walks in, the "mean" average salary in the room suddenly jumps to a billion dollars. This is why economists rarely use the mean for income brackets.
The Median: The Middle Ground
The median is found by taking all the numbers, sorting them from smallest to largest, and picking the exact middle number. If there is an even amount of numbers, you take the mean of the middle two.
The Benefit: Outliers do not affect the median. In the bar example above, even with Elon Musk present, the median salary remains exactly $50,000. It is a much better representation of the "typical" experience.
The Mode: The Most Frequent
The mode is simply the number that appears most frequently in a dataset. If a shoe store sells 100 pairs of shoes, and 45 of them are size 9, then size 9 is the mode.
To ensure you are getting the full statistical picture of any dataset, don't rely strictly on one metric. You can instantly calculate the Mean, Median, Mode, and Range simultaneously using our comprehensive Average Calculator.